Hugnot
Well-Known Member
Seems like everybody likes to get velocity extreme spread, standard deviations or SD values to measure the quality of ammo used to shoot various beasts just below the horizon on flat ground or across wide valleys - long range hunting.
Like:
 &
&
I like to use the free Open Office spread sheets -I can record data with descriptions in my computer & backup files to OneDrive
Like:

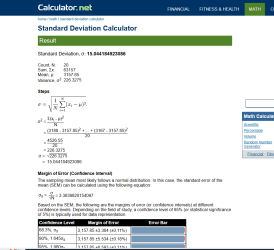
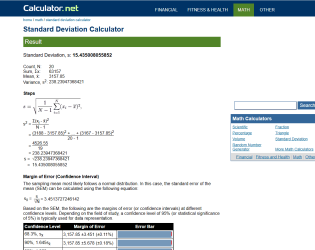
The Calculator.net provides a real good description of the process but does not allow for data display - 2 separate pages must be run for a group or sample data selection; no data descriptions may be included.
Variances for group standard deviations (SD) are derived by dividing the sum of squares by the number of cases then, taking the square root of that.
Variances for sample standard deviations (SD) are derived by dividing the sum of squares by the number of cases minus 1, then taking the square root of that.
In this situation N = 20 for group; N = 20-1 = 19 for sample. Calculator.net shows this.
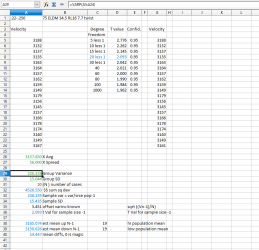
I wanted to record data having a description combined with SD & low to high velocity averages using 95% probability T values fitted to a normal distribution - left & right tails of bell shaped curve.
A look at the sample SD & group SD Calculator.net values (group SD=15.044 & sample SD = 15.435) shows they are equal to those displayed by Open Office.
Sample is green print N=20; group is blue print.
20 velocity values were analyzed. SD values obtained with N=20 (15.044) and SD values obtained with N=20-1 (15.435) were close, indicating 20 is good for SD determinations.
Various chronographs provide SD & spread value. The tiny little chips perform the math using floating point calculations.
From Wikipedia:
"A floating-point number is a numerical representation of a real number that can have a fractional component. It is stored in a computer's memory as a binary fraction, consisting of three components: the sign, the fraction, and the exponent 1"
My stuff uses an integer value. The Magneto Speed chip does floating point calculations with data values generated by magnetic field time/distance measurements that are more precise than integer values. The SD differences are not great for my needs & other shooting variables makes them unimportant
My self-imposed limit for deers & the like is 400 yards. I do rodent shooting, small targets, and consider the "point blank" range approach. I don't consider my abilities adequate to kill deers at extended just under the horizon ranges despite shooting high scores at 600 with many 10's & X's .
Like:
 &
&
I like to use the free Open Office spread sheets -I can record data with descriptions in my computer & backup files to OneDrive
Like:

The Calculator.net provides a real good description of the process but does not allow for data display - 2 separate pages must be run for a group or sample data selection; no data descriptions may be included.
Variances for group standard deviations (SD) are derived by dividing the sum of squares by the number of cases then, taking the square root of that.
Variances for sample standard deviations (SD) are derived by dividing the sum of squares by the number of cases minus 1, then taking the square root of that.
In this situation N = 20 for group; N = 20-1 = 19 for sample. Calculator.net shows this.
I wanted to record data having a description combined with SD & low to high velocity averages using 95% probability T values fitted to a normal distribution - left & right tails of bell shaped curve.
A look at the sample SD & group SD Calculator.net values (group SD=15.044 & sample SD = 15.435) shows they are equal to those displayed by Open Office.
Sample is green print N=20; group is blue print.
20 velocity values were analyzed. SD values obtained with N=20 (15.044) and SD values obtained with N=20-1 (15.435) were close, indicating 20 is good for SD determinations.
Various chronographs provide SD & spread value. The tiny little chips perform the math using floating point calculations.
From Wikipedia:
"A floating-point number is a numerical representation of a real number that can have a fractional component. It is stored in a computer's memory as a binary fraction, consisting of three components: the sign, the fraction, and the exponent 1"
My stuff uses an integer value. The Magneto Speed chip does floating point calculations with data values generated by magnetic field time/distance measurements that are more precise than integer values. The SD differences are not great for my needs & other shooting variables makes them unimportant
My self-imposed limit for deers & the like is 400 yards. I do rodent shooting, small targets, and consider the "point blank" range approach. I don't consider my abilities adequate to kill deers at extended just under the horizon ranges despite shooting high scores at 600 with many 10's & X's .
Last edited:
