This tool is used to understand how inaccuracy in the parameters you have entered for your rifle, scope, bullet, or shot affect the point of impact.
One of the important analysis is the
Circular Error Probable (CEP). This determine the minimum size circle of error which contains a certain fraction of impacts. This tool provides an inner CEP of
50% and an outer circle of
95%. The circles correspond to the area that will be impacted with
50% and
95% of the time, respectively.
The CEP values selected by this tool do not match those used in the CEP link. While CEP can be associated with normal distributions and standard deviations, the CEP displayed by this tool are calculated by sorting the results of the Monte Carlo simulation, not by multiplying the sstandard deviation.
The results of the simulation can be shown either in
Graphical or
Table display.
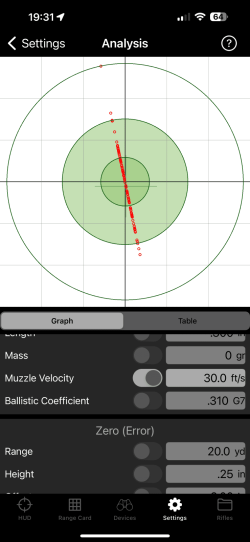
In Graphical display, the simulated points of impact are shown on a target display. Each simulated shot is shown as a small red circle. The target is automatically scaled according to how much dispersion the bullets have. The center of the target (marked by black cross hairs) shows desired point of impact.
A grid is with
1 MOA or
0.1 mRad spacing is shown.
Green shaded rings are shown for
50% and
95%CEP. A final circle is shown for the maximum error distance. When using a
Normal Distribution this final ring can be fairly large due to a high-error shot with low probability.
A small secondary green cross-hair is shown for the average impact point which is normally near the target center, but may vary somewhat.
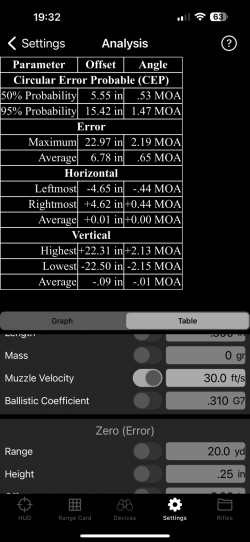
The Table display shows a numerical analysis of the dispersion. An Average and Maximum Error is shown. For each axis, the Minimum, Maximum, Average, and Standard Deviation are shown.
Values are shown both in absolute distance as well as
MOA or
mrad units.
Circular Error Probable values are shown for the
50% and
95% of samples.
The
Monte Carlo method is used for the analysis. This simply means that a simulation is repeatedly run. For each simulation, the tool selects random error based on selections you make and then simulates the shot based on the randomly chosen amount of error. After simulating a given number of times, the results are analyzed and displayed to show the pattern of impact that could occur.
The number of samples used for the Monte Carlo simulation. More samples can improve accuracy of the results but requires more time. This defaults to
1000. The minimum value is
1and maximum value is
10,000.
There are two types of error distributions used by this tool: Linear Distribution and Normal Distribution. A background in statistics may be helpful to fully understand this setting.
With a Linear Distribution, the error values will fall in the range of
+/- error for each selected error value. Each possible value has the same probability as any other. The error values will all fall into the range and will never exceed the give error value.
Important: The error values will extend over a range that is
2x the error value you enter. For instancs, if you enter a
Zero Offset error of
1in, then the error at the given
100yd range will be over
2 x 1in = 2in, which roughly corresponds to a
2 MOA range. For
1 MOA, you would use a value of
0.5 in.
With a
Normal Distribution, the error value you enter is the the
standard deviation of the error. As such,
68% of error values will be within the given range of error, +/-. If a muzzle velocity error of
10fps is set, then
68% of error will be in the range
-10fps to
+10fps (a total range of
20fps) of the muzzle velocity set for the bullet. This means some errors (approximately
32%) will fall outside this range.
The Recalculate button causes the simulation to be re-run. There is normally not a need to use this since new simulations are run whenever a value is changed.
For each of the parameters, you can choose whether or not to introduce error for that parameter and (if so) how much error.
When a parameter is changed, a new simulation is automatically started and the results are shown as soon as completed. There may be a few seconds of delay running the simulation.
The parameters available for a shot can be individually enabled/disabled and the size of distribution adjusted. You can enable as many or as few parameters as you choose. If no parameters are enabled, then the simulation will show no error. If a single parameter is selected, then only a single source of error is shown. As parameters are added, these are incorporated into the simulation. If all parameters are enabled, then all will be varied in the simulations.
- Zero Height & Offset: These can be used as rough stand-ins for the approximate accuracy of your setup.
If both Zero Height & Offset are enabled (and non-zero), a simple estimate of the accuracyis shown. This is calculated using the actual Zero Range (not the error value) and Zero Height & Offset. For instance, if using a 100ydZero Range, a 0.5in error setting for both Zero Height & Offset is estimated as corresponding to approximately 0.95 MOA of error.