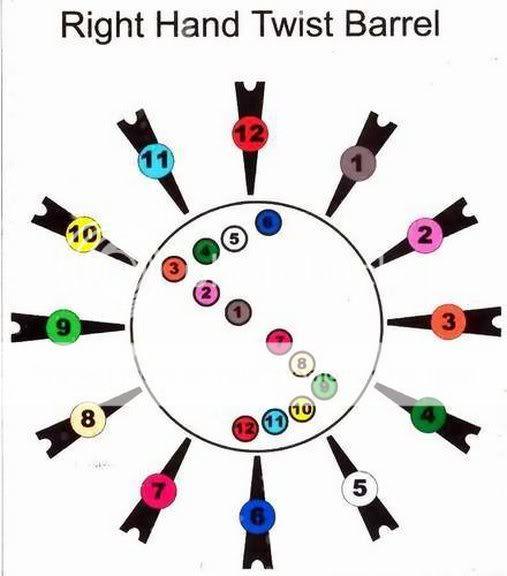
The first chart shows where the bullet would impact if the wind pushed it from 1, 2, 3, 10, and 12 o clock etc.
So the shooter is in the middle of the circle and gets a wind from 5 oclock. The bullet would land high and to the left but not as far to the left as if it would have been a 4 oclock wind. But the 5 oclock wind goes higher than the 4 oclock wind and so on. This is a good chart to see the percentages of wind effect on the bullet or what BR shooters call wind "value".
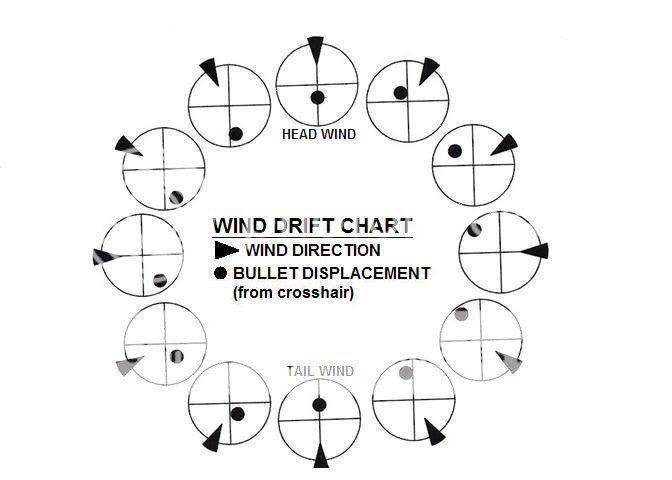
The second chart is similiar to the first but doesn't show quite as well the percentage effect or value. More shows the impact than value.
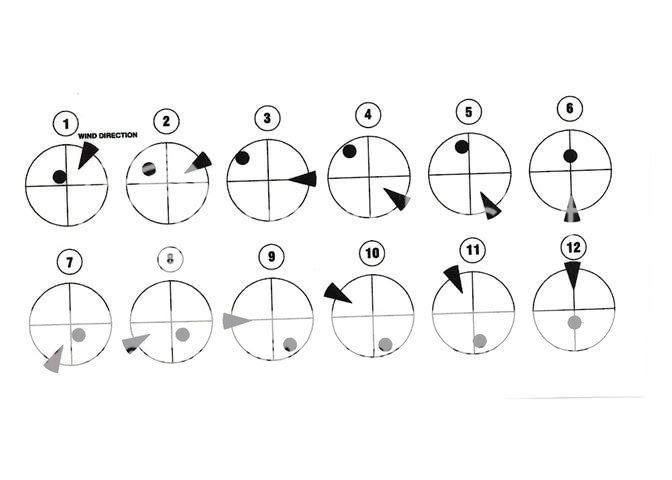
Third chart is connected to the second and I can't see any difference in it.
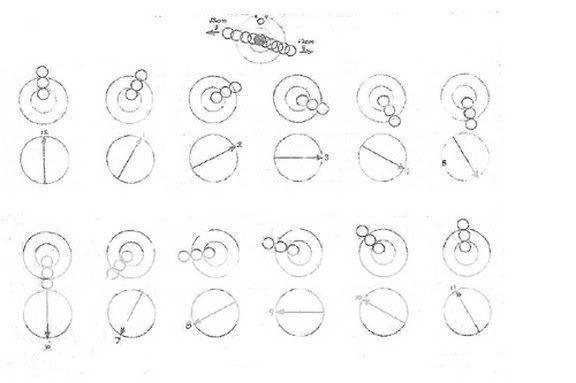
The fourth chart shows the impacts and values for differences in wind velocity and value. The diagram at the top of the chart is particularly useful as it shows the tendency of bullets to fly from a right hand twist.
As Bill figured out and Matt27 mentioned, this helps long range shooters figure out why they missed and helps them correct for varying winds when they keep a good log book or have a good memory!