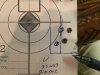
Then make a table of the vertical and horizontal values.
Use these values to compute the SD for both vertical and horizontal spread. You can then use the confidence interval to determine your chance of hitting a specific target at a specific range. You can also plot/determine your expected group size for a particular range. The 3 shot group is not large enough to be statistically significant. But using it as an example, Vertical SD was 0.300 and Horizontal SD was 0.301. Since they are nearly identical, we will use the horizontal of 0.301 X 6 = 1.806. I would expect the largest group from this gun/ammo/shooter combination to be 1.806" at 100 yds. or 1.806/1.047 = 1.725 MOA. If we are shooting a target at 500 yds, we could expect the largest group of 5 * 1.725 = 8.625"
If there is a greater difference in your vertical SD and horizontal SD, you can plot and oval and compute each one separately. The larger the group you have to work with, the more meaningful the SD.