AJ Peacock
Well-Known Member
Guys,
I have spent a lot of time formatting/re-formatting drop charts. Here is what I've come up with. Just thought I would share and see what others have come up with.
First of all, I use Nightforce scopes with the R1 reticle (which has 10MOA marks above the crosshair and 20moa marks below the crosshair).
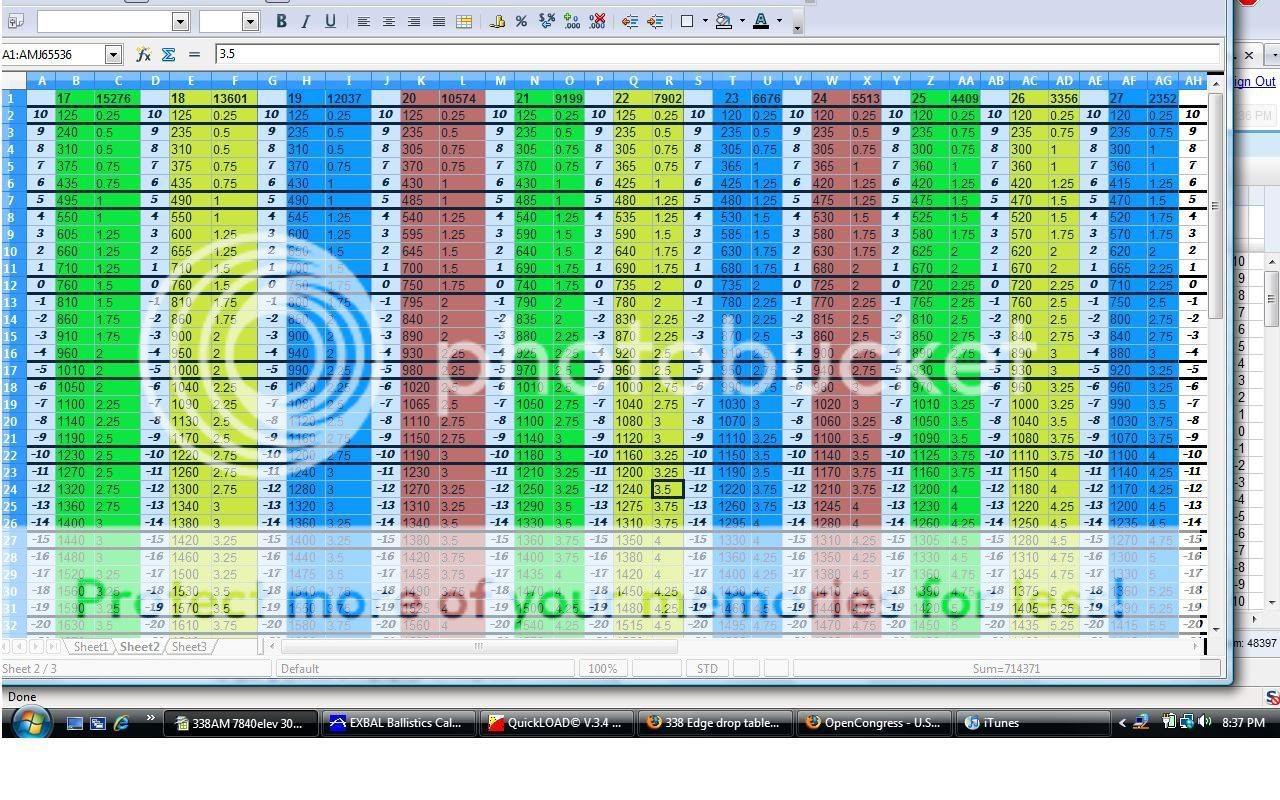
I decided that instead of using a set of given yardages and listing the MOA drops, I'd use a set of given MOA's (from 10moa above to 20moa below the crosshair) and list the appropriate yardages.
I then wanted to be able to use the chart at a number of different elevations, as a single day of hunting in Southern Colorado can easily require shots from 7000ft elevation to well over 14000ft !!
Here is what I came up with. With a simple Barometric pressure gauge, I can determine which line of the drop chart to use. If the pressure is between 2 of the lines, I've found that simply estimating between the 2 lines gives me VERY close info as compared to exbal on my PC.
So far, the drop chart has worked very well. As an example, the cell that is highlighted shows that for a barometric pressure of 22 (approximately 7902ft elevation) and a range of 1240yds , I would use my 12moa below the crosshair and would allow 3.5moa for a 10mph full value wind.
Let me know what you think.
AJ
I have spent a lot of time formatting/re-formatting drop charts. Here is what I've come up with. Just thought I would share and see what others have come up with.
First of all, I use Nightforce scopes with the R1 reticle (which has 10MOA marks above the crosshair and 20moa marks below the crosshair).
I decided that instead of using a set of given yardages and listing the MOA drops, I'd use a set of given MOA's (from 10moa above to 20moa below the crosshair) and list the appropriate yardages.
I then wanted to be able to use the chart at a number of different elevations, as a single day of hunting in Southern Colorado can easily require shots from 7000ft elevation to well over 14000ft !!
Here is what I came up with. With a simple Barometric pressure gauge, I can determine which line of the drop chart to use. If the pressure is between 2 of the lines, I've found that simply estimating between the 2 lines gives me VERY close info as compared to exbal on my PC.
So far, the drop chart has worked very well. As an example, the cell that is highlighted shows that for a barometric pressure of 22 (approximately 7902ft elevation) and a range of 1240yds , I would use my 12moa below the crosshair and would allow 3.5moa for a 10mph full value wind.
Let me know what you think.
AJ
 At the bottom of my chart I have the conditions it was run for and the correction factor for alternative conditions. Plus a separate piece of paper for cosine corrections

