Group Therapy - The Problem: How Accurate Is Your Rifle?
By Denton Bramwell
©Copyright, The Varmint Hunters Association, Inc.
Does it shoot 1" groups at 100 yards? Or 1/2" groups?
If you think it does, or think it doesn't, maybe you'll find this look at group size will change your mind.
One fine day, I ran into my friend Jim at the range. Jim is a real gentleman, and he delights in fine-tuning his rifles. "Hey Jim, did you get that 308 of yours settled down and shooting?"
"Sure did. I've got it shooting 5/8-inch. Of course, I got it to do that only once."
I smiled. My friend was in the midst of a common misunderstanding about testing group size. He thought that the 5/8" group was the one time he did everything right, that the other times, his technique wasn't perfect. The illusion is that if his technique were better, he could consistently get that group size. But it just isn't so. Rifles produce larger and smaller groups without an identifiable cause. The trick is knowing when a change is big enough to be attributed to an identifiable cause, and not the sum of the many, tiny, unidentifiable causes. More than likely Jim's rifle was not displaying the results of an identifiable cause, and he hadn't done anything really different to get that 5/8-inch group.
A second issue is that it makes no sense whatever to speak of group size without also specifying the number of shots. If you think about it for a moment, no group will ever be smaller than the spacing between the first two shots. Groups can only get bigger as you add more shots. So, for the same accuracy, and all other factors equal, groups with more shots will, on average, be larger than groups with fewer shots. One thing we need is the ability to convert back and forth between average group sizes shot with different numbers of shots.
In this article, I will attempt to address both issues, separating real change from normal random variation, and properly comparing average group size when different numbers of shots are fired for each group.
Some Mathematical Musings
Measuring the center-to-center distance between the two most distant bullet holes is the most widely accepted method for measuring group size. This is one measure I will use in this article.
Another tool I will use is standard deviation. That is a measure used both in and out of the shooting hobby, and I used it to create the simulation needed to find what constitutes "usual" and "unusual" behavior.
Such measures as mean distance from the center contain no information that is not in standard deviation, and they are much more difficult to work with. So let's keep it simple, and use the widely accepted measures.
An Important Definition
The limiting factors for accuracy can be divided into two groups. One group is problems that can be identified and eliminated, such as a stock putting pressure on a barrel, shooter flinch, or a loose scope. These are called "special cause." The other group is made up of many tiny causes lumped together, that are characteristic of the process, and probably always present. These might include normal tiny imbalances in the bullet, a speck of grit on the crown, and normal random variation in bullet weight. We lump these together as "common cause," and treat them statistically.
In order for what follows to work properly, the rifle must be free from special cause, with only normal, random variation (common cause) remaining. In other words, you have to have already gotten the rifle settled down and shooting as well as it can.
A Terrible Choice: Imperfect Information, Or No Longer Interesting Information
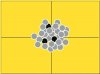
One way to get a real truth about group size is to start with a very large pile of ammunition, and shoot groups of the same size until the barrel wears out. The average group size we get by measuring all the groups is the true average group size for that number of shots. We might think of this as being represented by Figure 1. Unfortunately, this information is no longer useful, because the barrel is now worn out, and of no further use. So we usually use a different approach.
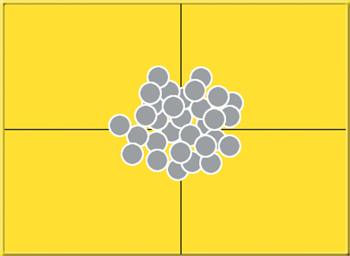
Figure 1
That other approach is to shoot a small number of shots — a sample. This will not give a perfectly accurate result. It will be an imperfect estimate. We just have to be aware of the deal we have made with the devil, and interpret the results accordingly. Samples are represented in Figures 2 and 3 as being randomly selected from Figure 1.
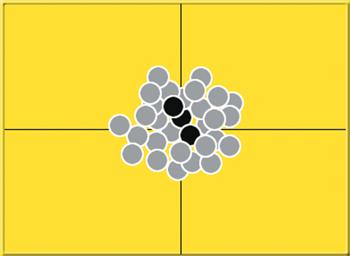
Figure 2
Figure 3
If our sample happens to look like the three highlighted shots in Figure 2, we might go home whistling Dixie in the key of C, and certain that the rifle is shooting fine as frog's hair split three ways. Or, we might draw the sample highlighted in Figure 3, and go home determined to work on our shooting technique, and wondering what we have done wrong. Both Figure 2 and Figure 3 are samples drawn out of the large population in Figure 1, and, as we shall see, are roughly equally likely. It is easy to be seduced into believing that Figure 2 and Figure 3 somehow represent different performance from the shooter, the rifle, or the ammunition. But we will find there is no evidence that they do.
How Far Out Is "Unusual"? Building The Model
In order to do a good job of evaluating what constitutes "normal random variation," or common cause, and what is unusual enough to constitute special cause, we need a basis of comparison. So we need some sort of model, based on random variation.
If the model can explain Jim's experience in terms of normal, random variation, there is no benefit in looking for any special explanation, such as flinch or stock pressure. If normal random variation cannot explain the variation in group size, then Jim does have some work to do on his rifle. This approach will answer one of our two original questions. With a little additional work, we can get our second answer out of the same pile of data.
Group size is kind of an ugly quantity to model mathematically. I thought about it for a while, and then decided that the convenient approach was simulation. I simply created 20,000 simulated shots in a computer, with normally distributed horizontal and vertical components. I then had the computer find the group size for three, four, and five-shot groups, and drew conclusions from that. If the rifle is free from special cause, this makes a very good model.
I fear that the gory mathematical details would be enough to cause some readers to run screaming from the room, so, to avoid that, and to spare readers' spouses, I have shielded your gentle eyes from all that, and simply report the findings that I think may be useful or entertaining. The two masochistic readers in the entire world who are truly interested in all the details can contact me directly.
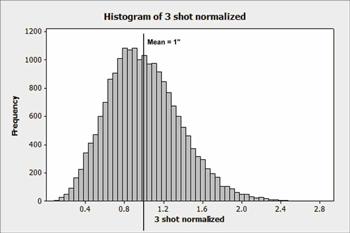
Figure 4
Figure 4 is the result of the simulation, and it gives us a reference that shows what normal, common cause behavior is. Note that a rifle with a true three-shot average group size of 1" will naturally produce a fairly broad range of group sizes, without any identifiable change in the shooter, the firearm, or the ammunition. Also note that a 1" rifle will, on rare occasions, produce a few groups as large as 2.4", and a few as small as 0.2", just from normal random variation. If you shoot enough groups, the worst sewer-pipe bullet hose you can find occasionally will shoot a fine group. And it wasn't anything you did. It was just your lucky day.
The Results And Conclusions
1. If the bullet impact distances from the center are normally distributed, then the distribution of group is not normally distributed, as shown in Figure 4. This distribution shows what you can expect when shooting three-shot groups, when only common cause is present, i.e., no changes in the rifle, ammunition, or shooter.
More than half the curve lies below the mean. More often than not, this type of sample will underestimate the true mean. Yup: You'll more often than not get a group size that is better than you "should."
This also can explain my friend Jim's result. A rifle that has a long-term average group size of 1", for an easy example, will fairly often produce groups as small as 5/8". Chances are, your next group won't be that small. It doesn't matter, it's not telling you that anything has changed, and there isn't much you can do about it anyway, short of something major like a new barrel.
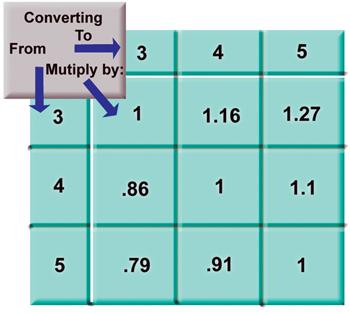
Figure 5
2. If you want to convert the long-term average of groups shot at three, four, or five shots per group to any other number of shots, you can use the numbers from Figure 5. If you've been keeping careful track of the size of your five-shot groups, and they are averaging 0.75", you could expect 0.75" x 0.79 = 0.59" groups if you switch to three-shot groups. The numbers in the table were found using calculations from the large simulation shown in Figure 4.
3. This conclusion may be the most difficult to grasp, and the most important: From the simulation, we know how broad a dispersion we can expect from groups with various numbers of shots. Common statistical practice is to choose limits that include 95 percent of the data. Variation within these limits should be interpreted as normal, random variation, and not variation due to changes in rifle, shooter, or ammunition.
For three-shot groups: 43 percent of the long-term average to 165 percent of the long-term average is just normal, random variation.
For four-shot groups: 53 percent of the long-term average to 154 percent of the long-term average is just normal, random variation.
For five-shot groups: 58 percent of the long-term average to 147 percent of the long-term average is just normal random variation.
If your rifle prints 1" three-shot groups on average, no single group that is larger than 0.43 inch or smaller than 1.65 inches is evidence of real change.
This ought to give you pause when you see an article testing one brand of ammunition against another, with only one five-shot group representing each brand. Such comparisons are close to worthless, for the reasons shown here.
If you want to test the long-term group size of your rifle, I suggest that you shoot three five-shot groups and take the average. This average will give you the true value, plus or minus 25 percent, 95 percent of the time. Getting it much tighter than that takes a lot more ammunition. Shooting twelve groups instead of three roughly halves the error. Three five-shot groups are a good balance between precision and cost.
4. If you shoot a five-shot group whose longest dimension is at least three times the dimension at right angles to the longest dimension, you have a sample that strongly indicates stringing. If the ratio is less than 3:1, a single oblong group is not evidence of stringing.
By Denton Bramwell
©Copyright, The Varmint Hunters Association, Inc.
Does it shoot 1" groups at 100 yards? Or 1/2" groups?
If you think it does, or think it doesn't, maybe you'll find this look at group size will change your mind.
One fine day, I ran into my friend Jim at the range. Jim is a real gentleman, and he delights in fine-tuning his rifles. "Hey Jim, did you get that 308 of yours settled down and shooting?"
"Sure did. I've got it shooting 5/8-inch. Of course, I got it to do that only once."
I smiled. My friend was in the midst of a common misunderstanding about testing group size. He thought that the 5/8" group was the one time he did everything right, that the other times, his technique wasn't perfect. The illusion is that if his technique were better, he could consistently get that group size. But it just isn't so. Rifles produce larger and smaller groups without an identifiable cause. The trick is knowing when a change is big enough to be attributed to an identifiable cause, and not the sum of the many, tiny, unidentifiable causes. More than likely Jim's rifle was not displaying the results of an identifiable cause, and he hadn't done anything really different to get that 5/8-inch group.
A second issue is that it makes no sense whatever to speak of group size without also specifying the number of shots. If you think about it for a moment, no group will ever be smaller than the spacing between the first two shots. Groups can only get bigger as you add more shots. So, for the same accuracy, and all other factors equal, groups with more shots will, on average, be larger than groups with fewer shots. One thing we need is the ability to convert back and forth between average group sizes shot with different numbers of shots.
In this article, I will attempt to address both issues, separating real change from normal random variation, and properly comparing average group size when different numbers of shots are fired for each group.
Some Mathematical Musings
Measuring the center-to-center distance between the two most distant bullet holes is the most widely accepted method for measuring group size. This is one measure I will use in this article.
Another tool I will use is standard deviation. That is a measure used both in and out of the shooting hobby, and I used it to create the simulation needed to find what constitutes "usual" and "unusual" behavior.
Such measures as mean distance from the center contain no information that is not in standard deviation, and they are much more difficult to work with. So let's keep it simple, and use the widely accepted measures.
An Important Definition
The limiting factors for accuracy can be divided into two groups. One group is problems that can be identified and eliminated, such as a stock putting pressure on a barrel, shooter flinch, or a loose scope. These are called "special cause." The other group is made up of many tiny causes lumped together, that are characteristic of the process, and probably always present. These might include normal tiny imbalances in the bullet, a speck of grit on the crown, and normal random variation in bullet weight. We lump these together as "common cause," and treat them statistically.
In order for what follows to work properly, the rifle must be free from special cause, with only normal, random variation (common cause) remaining. In other words, you have to have already gotten the rifle settled down and shooting as well as it can.
A Terrible Choice: Imperfect Information, Or No Longer Interesting Information
One way to get a real truth about group size is to start with a very large pile of ammunition, and shoot groups of the same size until the barrel wears out. The average group size we get by measuring all the groups is the true average group size for that number of shots. We might think of this as being represented by Figure 1. Unfortunately, this information is no longer useful, because the barrel is now worn out, and of no further use. So we usually use a different approach.
Figure 1
That other approach is to shoot a small number of shots — a sample. This will not give a perfectly accurate result. It will be an imperfect estimate. We just have to be aware of the deal we have made with the devil, and interpret the results accordingly. Samples are represented in Figures 2 and 3 as being randomly selected from Figure 1.
Figure 2
Figure 3
If our sample happens to look like the three highlighted shots in Figure 2, we might go home whistling Dixie in the key of C, and certain that the rifle is shooting fine as frog's hair split three ways. Or, we might draw the sample highlighted in Figure 3, and go home determined to work on our shooting technique, and wondering what we have done wrong. Both Figure 2 and Figure 3 are samples drawn out of the large population in Figure 1, and, as we shall see, are roughly equally likely. It is easy to be seduced into believing that Figure 2 and Figure 3 somehow represent different performance from the shooter, the rifle, or the ammunition. But we will find there is no evidence that they do.
How Far Out Is "Unusual"? Building The Model
In order to do a good job of evaluating what constitutes "normal random variation," or common cause, and what is unusual enough to constitute special cause, we need a basis of comparison. So we need some sort of model, based on random variation.
If the model can explain Jim's experience in terms of normal, random variation, there is no benefit in looking for any special explanation, such as flinch or stock pressure. If normal random variation cannot explain the variation in group size, then Jim does have some work to do on his rifle. This approach will answer one of our two original questions. With a little additional work, we can get our second answer out of the same pile of data.
Group size is kind of an ugly quantity to model mathematically. I thought about it for a while, and then decided that the convenient approach was simulation. I simply created 20,000 simulated shots in a computer, with normally distributed horizontal and vertical components. I then had the computer find the group size for three, four, and five-shot groups, and drew conclusions from that. If the rifle is free from special cause, this makes a very good model.
I fear that the gory mathematical details would be enough to cause some readers to run screaming from the room, so, to avoid that, and to spare readers' spouses, I have shielded your gentle eyes from all that, and simply report the findings that I think may be useful or entertaining. The two masochistic readers in the entire world who are truly interested in all the details can contact me directly.
Figure 4
Figure 4 is the result of the simulation, and it gives us a reference that shows what normal, common cause behavior is. Note that a rifle with a true three-shot average group size of 1" will naturally produce a fairly broad range of group sizes, without any identifiable change in the shooter, the firearm, or the ammunition. Also note that a 1" rifle will, on rare occasions, produce a few groups as large as 2.4", and a few as small as 0.2", just from normal random variation. If you shoot enough groups, the worst sewer-pipe bullet hose you can find occasionally will shoot a fine group. And it wasn't anything you did. It was just your lucky day.
The Results And Conclusions
1. If the bullet impact distances from the center are normally distributed, then the distribution of group is not normally distributed, as shown in Figure 4. This distribution shows what you can expect when shooting three-shot groups, when only common cause is present, i.e., no changes in the rifle, ammunition, or shooter.
More than half the curve lies below the mean. More often than not, this type of sample will underestimate the true mean. Yup: You'll more often than not get a group size that is better than you "should."
This also can explain my friend Jim's result. A rifle that has a long-term average group size of 1", for an easy example, will fairly often produce groups as small as 5/8". Chances are, your next group won't be that small. It doesn't matter, it's not telling you that anything has changed, and there isn't much you can do about it anyway, short of something major like a new barrel.
Figure 5
2. If you want to convert the long-term average of groups shot at three, four, or five shots per group to any other number of shots, you can use the numbers from Figure 5. If you've been keeping careful track of the size of your five-shot groups, and they are averaging 0.75", you could expect 0.75" x 0.79 = 0.59" groups if you switch to three-shot groups. The numbers in the table were found using calculations from the large simulation shown in Figure 4.
3. This conclusion may be the most difficult to grasp, and the most important: From the simulation, we know how broad a dispersion we can expect from groups with various numbers of shots. Common statistical practice is to choose limits that include 95 percent of the data. Variation within these limits should be interpreted as normal, random variation, and not variation due to changes in rifle, shooter, or ammunition.
For three-shot groups: 43 percent of the long-term average to 165 percent of the long-term average is just normal, random variation.
For four-shot groups: 53 percent of the long-term average to 154 percent of the long-term average is just normal, random variation.
For five-shot groups: 58 percent of the long-term average to 147 percent of the long-term average is just normal random variation.
If your rifle prints 1" three-shot groups on average, no single group that is larger than 0.43 inch or smaller than 1.65 inches is evidence of real change.
This ought to give you pause when you see an article testing one brand of ammunition against another, with only one five-shot group representing each brand. Such comparisons are close to worthless, for the reasons shown here.
If you want to test the long-term group size of your rifle, I suggest that you shoot three five-shot groups and take the average. This average will give you the true value, plus or minus 25 percent, 95 percent of the time. Getting it much tighter than that takes a lot more ammunition. Shooting twelve groups instead of three roughly halves the error. Three five-shot groups are a good balance between precision and cost.
4. If you shoot a five-shot group whose longest dimension is at least three times the dimension at right angles to the longest dimension, you have a sample that strongly indicates stringing. If the ratio is less than 3:1, a single oblong group is not evidence of stringing.